
Query properties and display them as plot
This query plots the values of a page property over time (page properties stored in journal pages). The value of the page property must be numeric and a whole number, other values will not be used. Positive and negative values are allowed. The x-axis shows the date, the y-axis the value of the property.
The styling and color is adapted to the current Looksyk theme.
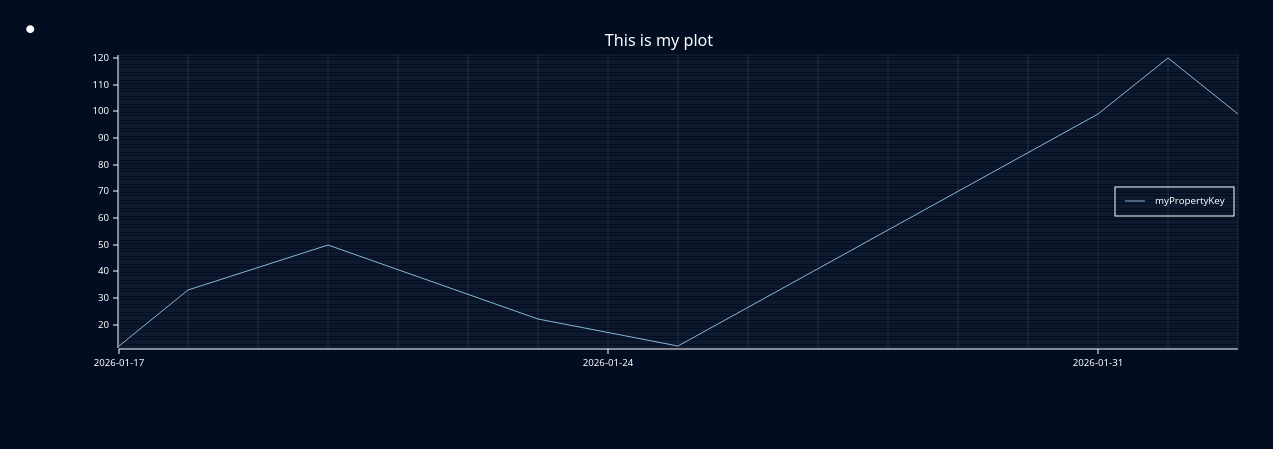
Quick example:
{query: plot-property propertyKey:"myPropertyKey" title:"This is my plot" width:"1200" height:"400" startingAt:"1999-01-01" endingAt:"2050-12-31" display:"linechart" }
Configuration parameters:
| Parameter | Description |
|---|---|
| propertyKey | Key of the page property to be plotted. |
| title | Title of the plot. |
| width | Width of the plot in pixels. |
| height | Height of the plot in pixels. |
| startingAt | Start date for the x-axis (format: YYYY-MM-DD). |
| endingAt | End date for the x-axis (format: YYYY-MM-DD). |
| display | Type of plot. Currently supported: linechart. |